Actuele waterstand
Waterstand tov LAT: niet beschikbaar
Meettijd: 10:00 uur
Op de waterkaart
Kies je getijstation
Download de app
Met de app Het Getij heb je altijd en overal de actuele getijgegevens bij de hand.
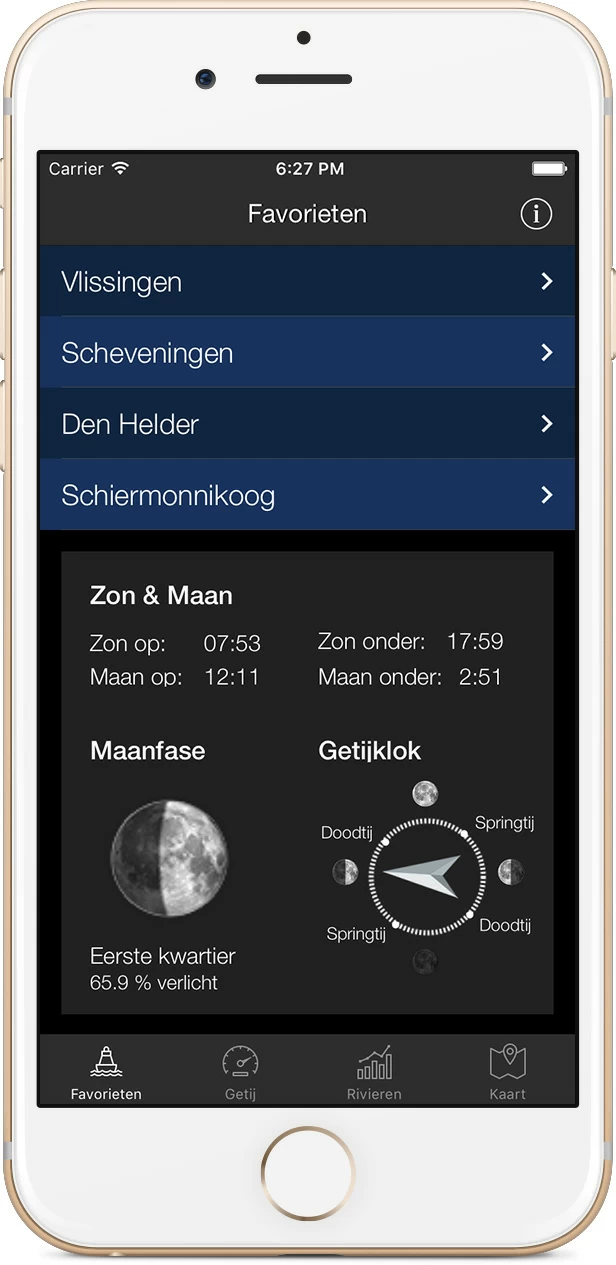
Download de app voor iOS of Android.
Het getij voor West-Terschelling
| 1 August Laag water om 05:52 uur Waterstand tov NAP: -107 cm | LAT: 41 cm |
| 1 August Hoog water om 12:01 uur Waterstand tov NAP: 104 cm | LAT: 252 cm |
| 1 August Laag water om 18:22 uur Waterstand tov NAP: -105 cm | LAT: 43 cm |
| 2 August Hoog water om 00:19 uur Waterstand tov NAP: 67 cm | LAT: 215 cm |
| 2 August Laag water om 06:27 uur Waterstand tov NAP: -110 cm | LAT: 38 cm |
| 2 August Hoog water om 12:34 uur Waterstand tov NAP: 104 cm | LAT: 252 cm |
| 2 August Laag water om 18:58 uur Waterstand tov NAP: -105 cm | LAT: 43 cm |
| 3 August Hoog water om 00:51 uur Waterstand tov NAP: 64 cm | LAT: 212 cm |
| 3 August Laag water om 07:03 uur Waterstand tov NAP: -111 cm | LAT: 37 cm |
| 3 August Hoog water om 13:07 uur Waterstand tov NAP: 102 cm | LAT: 250 cm |
| 3 August Laag water om 19:33 uur Waterstand tov NAP: -102 cm | LAT: 46 cm |
| 4 August Hoog water om 01:21 uur Waterstand tov NAP: 62 cm | LAT: 210 cm |
| 4 August Laag water om 07:39 uur Waterstand tov NAP: -110 cm | LAT: 38 cm |
| 4 August Hoog water om 13:41 uur Waterstand tov NAP: 98 cm | LAT: 246 cm |
| 4 August Laag water om 20:08 uur Waterstand tov NAP: -98 cm | LAT: 50 cm |
| 5 August Hoog water om 01:54 uur Waterstand tov NAP: 61 cm | LAT: 209 cm |
| 5 August Laag water om 08:16 uur Waterstand tov NAP: -108 cm | LAT: 40 cm |
| 5 August Hoog water om 14:19 uur Waterstand tov NAP: 93 cm | LAT: 241 cm |
| 5 August Laag water om 20:46 uur Waterstand tov NAP: -93 cm | LAT: 55 cm |
| 6 August Hoog water om 02:33 uur Waterstand tov NAP: 60 cm | LAT: 208 cm |
| 6 August Laag water om 08:58 uur Waterstand tov NAP: -103 cm | LAT: 45 cm |
| 6 August Hoog water om 15:02 uur Waterstand tov NAP: 85 cm | LAT: 233 cm |
| 6 August Laag water om 21:28 uur Waterstand tov NAP: -86 cm | LAT: 62 cm |
| 7 August Hoog water om 03:21 uur Waterstand tov NAP: 60 cm | LAT: 208 cm |
| 7 August Laag water om 09:47 uur Waterstand tov NAP: -95 cm | LAT: 53 cm |
| 7 August Hoog water om 15:58 uur Waterstand tov NAP: 75 cm | LAT: 223 cm |
| 7 August Laag water om 22:22 uur Waterstand tov NAP: -78 cm | LAT: 70 cm |
| 8 August Hoog water om 04:28 uur Waterstand tov NAP: 59 cm | LAT: 207 cm |
| 8 August Laag water om 10:53 uur Waterstand tov NAP: -85 cm | LAT: 63 cm |
| 8 August Hoog water om 17:19 uur Waterstand tov NAP: 67 cm | LAT: 215 cm |
| 8 August Laag water om 23:34 uur Waterstand tov NAP: -72 cm | LAT: 76 cm |
| 9 August Hoog water om 05:55 uur Waterstand tov NAP: 64 cm | LAT: 212 cm |
| 9 August Laag water om 12:19 uur Waterstand tov NAP: -82 cm | LAT: 66 cm |
| 9 August Hoog water om 18:50 uur Waterstand tov NAP: 66 cm | LAT: 214 cm |
| 10 August Laag water om 00:58 uur Waterstand tov NAP: -74 cm | LAT: 74 cm |
| 10 August Hoog water om 07:23 uur Waterstand tov NAP: 77 cm | LAT: 225 cm |
| 10 August Laag water om 13:48 uur Waterstand tov NAP: -89 cm | LAT: 59 cm |
| 10 August Hoog water om 20:08 uur Waterstand tov NAP: 71 cm | LAT: 219 cm |
| 11 August Laag water om 02:19 uur Waterstand tov NAP: -84 cm | LAT: 64 cm |
| 11 August Hoog water om 08:36 uur Waterstand tov NAP: 93 cm | LAT: 241 cm |
| 11 August Laag water om 15:06 uur Waterstand tov NAP: -103 cm | LAT: 45 cm |
| 11 August Hoog water om 21:16 uur Waterstand tov NAP: 77 cm | LAT: 225 cm |
| Geen astronomische verwachting beschikbaar |
| Geen opzetverwachting beschikbaar |
Getijcurve West-Terschelling
Bovenstaande grafiek laat het verloop van het getij bij West-Terschelling zien. De blauwe lijn volgt daarbij de astronomische getijverwachting in NAP, dat zijn de gegevens die je ook in de tabel links in de kolom '10 min' ziet. De oranje lijn echter laat de astronomische verwachting zien plus - of min - de opzet. Daarin zijn dus de invloeden van het weer en stroming meegenomen, waardoor de oranje lijn het meest waarschijnlijke scenario weergeeft. Over de referentievlakken (NAP en LAT)
De meeste getijdengegevens die je hier ziet worden ten opzichte van NAP (Normaal Amsterdams Peil) weergegeven. Echter de meetstations Aukfield, Europlatform, K13A en het Lichteiland Goeree geven hun waardes in MSL, Mean Sea Level, wat het gemiddelde niveau van de zeespiegel weergeeft. LAT is een internationaal referentievlak en staat voor Lowest Astronomical Tide. Het wordt gebruikt als referentievlak voor waterdieptes op zeekaarten. Als je deze gebruikt kun je dus het beste dit niveau aanhouden. LAT geeft het laagst mogelijke getij op een bepaalde plek weer, dat alleen op hoogst uitzonderlijke momenten wordt bereikt. Normaal gesproken zal het waterpeil er dus altijd boven staan.
Voor iedere getijdenlocatie is een standaardverschil bekend tussen NAP en LAT, het standaardverschil tussen NAP en LAT bij West-Terschelling is: cm
Meer weten? De Stichting Wadvaarders heeft een interessante uitleg over LAT vs. NAP op zijn website staan.
Overzicht meetstations
Kaart van Nederland